Contents
What are aggregated statistics in football?
Aggregated statistics in football are data compiled across multiple matches, such as over a season, within a competition, or during a specific period, as opposed to individual per-match results. These statistics offer a broad overview of performance by combining metrics like total goals, assists, or average possession. The process involves summing, averaging, or otherwise mathematically combining data from numerous games to identify overarching trends, consistencies, strengths, and weaknesses in team or player performance over time.
Importance in football analysis
Aggregated statistics are important for assessing performance over time, showing consistency, strengths, and weaknesses. Coaches use them to refine strategies, scouts use them to spot talent, and analysts apply them to predict match results or player potential. For example, a team’s season total shots on target shows attacking efficiency, while aggregated yellow cards may signal disciplinary issues. Platforms like Sportmonks enhance these analyses with reliable metrics, such as xG, shot accuracy, pass accuracy and so on, supporting informed decisions in scouting, fantasy football, and strategic planning.
Methods of aggregation
The process of aggregating data involves applying various mathematical and statistical techniques to combine individual data points. The specific method employed depends heavily on the type of data being analysed and the insights sought. Some common methods of aggregation include:
– Summation: Adding together all the individual values within a dataset to obtain a total e.g. total shots in the season by a player. This is useful for understanding overall quantities or volumes.
– Averaging (Mean): Calculating the arithmetic mean by summing all values and dividing by the number of values e.g. goals per game by a player. This provides a measure of the central tendency of the data.
– Median: Finding the middle value in a sorted dataset. This is a measure of central tendency that is less affected by extreme outliers than the mean.
– Mode: Determining the value that appears most frequently in a dataset. This is useful for understanding the most typical or common occurrence. Eg the minute a team is most likely to score a goal.
– Counting: Determining the number of occurrences of a specific value or the total number of data points within a defined group or category.
– Percentage calculation: Expressing a part of the whole as a fraction of 100. This is useful for understanding proportions and relative frequencies e.g. the ball possession of a team.
– Range: Identifying the difference between the maximum and minimum values in a dataset, providing a measure of the data’s spread.
– Variance and standard deviation: Calculating measures of the dispersion or spread of data around the mean, indicating how much individual data points deviate from the average.
Common aggregated stats in football
Common aggregated statistics in football provide insights into various performance aspects, often grouped by category:
Attacking
– Total goals scored/conceded: These simple sums over a season or multiple matches provide a basic understanding of a team’s attacking and defensive output.
– Shots for/against per game: Aggregating the total shots taken and faced, then dividing by the number of games, indicates a team’s attacking intent and defensive vulnerability in terms of shot volume.
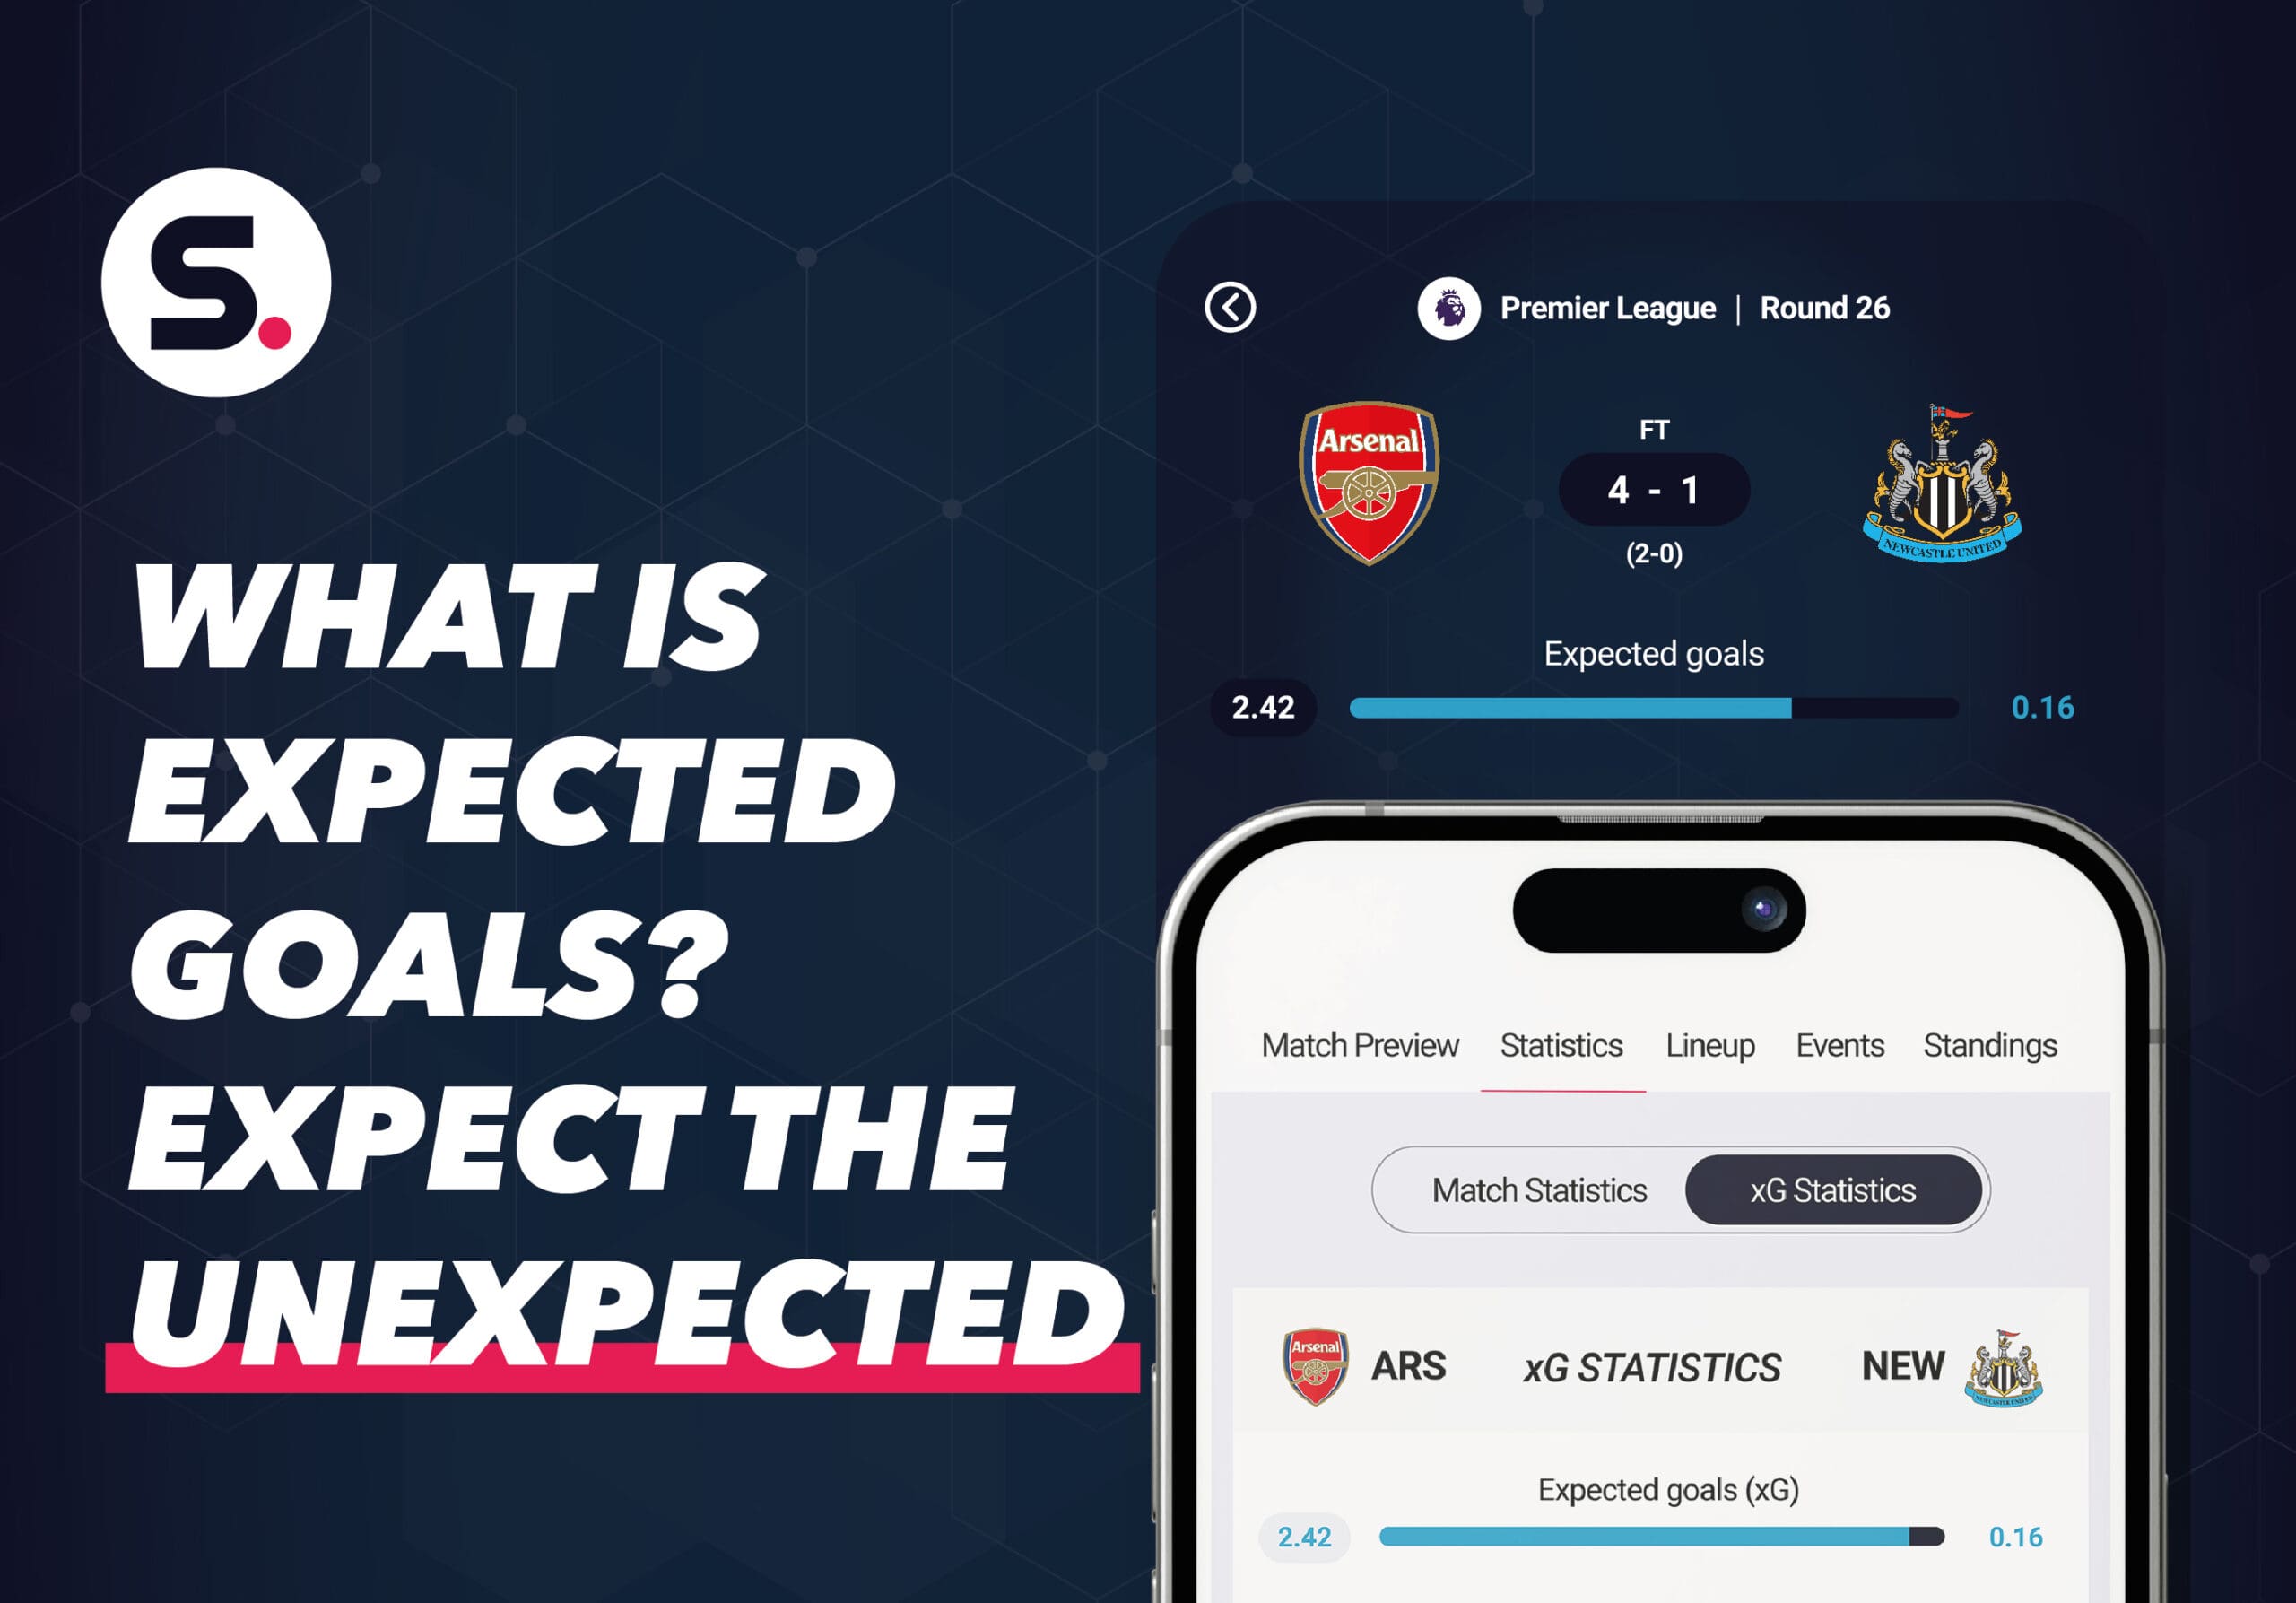
– Expected goals (xG) accumulated: Summing the xG values from each shot taken by a player or team over a series of matches provides a statistical expectation of the number of goals they should have scored based on the quality of their chances.
– Cross completion rate: Calculating the percentage of successful crosses out of all attempted crosses highlights the effectiveness of a team’s crossing ability.
Possession
– Average possession percentage: Summing the possession percentages in each match and dividing by the number of matches gives an overview of a team’s tendency to control the ball.
– Pass completion rate (overall/key passes): Calculating the percentage of successful passes out of all attempted passes, often further broken down by type of pass (e.g., key passes leading to scoring opportunities), highlights a team’s passing accuracy.
Defensive
– Tackles won percentage: Aggregating the number of successful tackles divided by the total tackles attempted indicates defensive effectiveness in winning possession.
Outcome
– Win/loss/draw percentage: Aggregating the outcomes of matches over a period reveals a team’s overall success rate.
Physical
– Distance covered per player/team per game: Aggregating the total distance covered by individual players or the entire team during matches offers insights into work rate and physical exertion.
“Access a wide range of football stats like xG and tackles won with Sportmonks’ API. Get started now.
Benefits of using aggregated stats
The increasing reliance on aggregated statistics in football analysis stems from the numerous benefits they offer to various stakeholders:
– Identifying long-term trends: Aggregating data over extended periods helps identify consistent patterns and trends in team and player performance that might be ignored by observing just the individual matches. This helps in understanding sustainable strengths and weaknesses.
– Evaluating overall performance: Aggregated stats provide a combined view of performance, moving beyond the understanding of single games. They offer a more objective measure of a team’s or player’s effectiveness over time.
– Helping with comparisons: Aggregated data allows for meaningful comparisons between different teams, players, leagues, and even historical periods.
– Helping with decision making: Coaches and analysts use aggregated stats to make informed decisions, find areas for improvement in training, and measure the effectiveness of different playing styles over a series of games.
– Informing signings: Clubs can use aggregated player statistics to scout potential transfer targets, assessing their long-term performance, and consistency for the team’s playing style.
Pitfalls with aggregated stats
Despite their many benefits, it’s important to use aggregated statistics with a critical eye and know its limits.
– Loss of context: Aggregation often sacrifices the specific context of individual events. A goal scored against a struggling team in the opening minutes might be weighted the same in a season total as a crucial late winner against a title rival.
– Hiding short term inconsistencies: Long-term averages can hide recent changes in form or tactical adjustments that might be more relevant for immediate analysis.
– Accuracy based on sample size: Aggregated stats based on a small number of matches can be unreliable and prone to distortion. Larger sample sizes provide a more stable picture.
– Accuracy of considered data: The accuracy of aggregated stats is dependent on the quality of the raw data collected. Errors in the initial data will slip into the aggregated figures.
– Oversimplifying the sport: Football is a complex team sport, and reducing performance to a few aggregated numbers oversimplifies the detailed relationships between players, tactics, and game situations.
– Drawing combined conclusions: Drawing conclusions about a player’s individual abilities largely based on team-level aggregated stats can be misleading. A low pass completion rate for a team might not necessarily mean every individual player is a poor passer.
– Ignoring immeasurable factors: Aggregated stats primarily deal with quantifiable data and may not capture crucial aspects of the game, such as team chemistry, player morale, match significance, rivalry bad blood or the impact of specific managerial decisions.
Available aggregated statistics on Sportmonks
Below is a categorised list of commonly available aggregated statistics offered through Sportmonks’ football API, which covers over 2,500 leagues globally. These stats are typical of what analysts, coaches, and developers might access, though specific availability varies by platform and subscription plan. For a comprehensive overview of all statistics endpoints and their configurations, visit our statistics endpoints documentation.
Attacking statistics
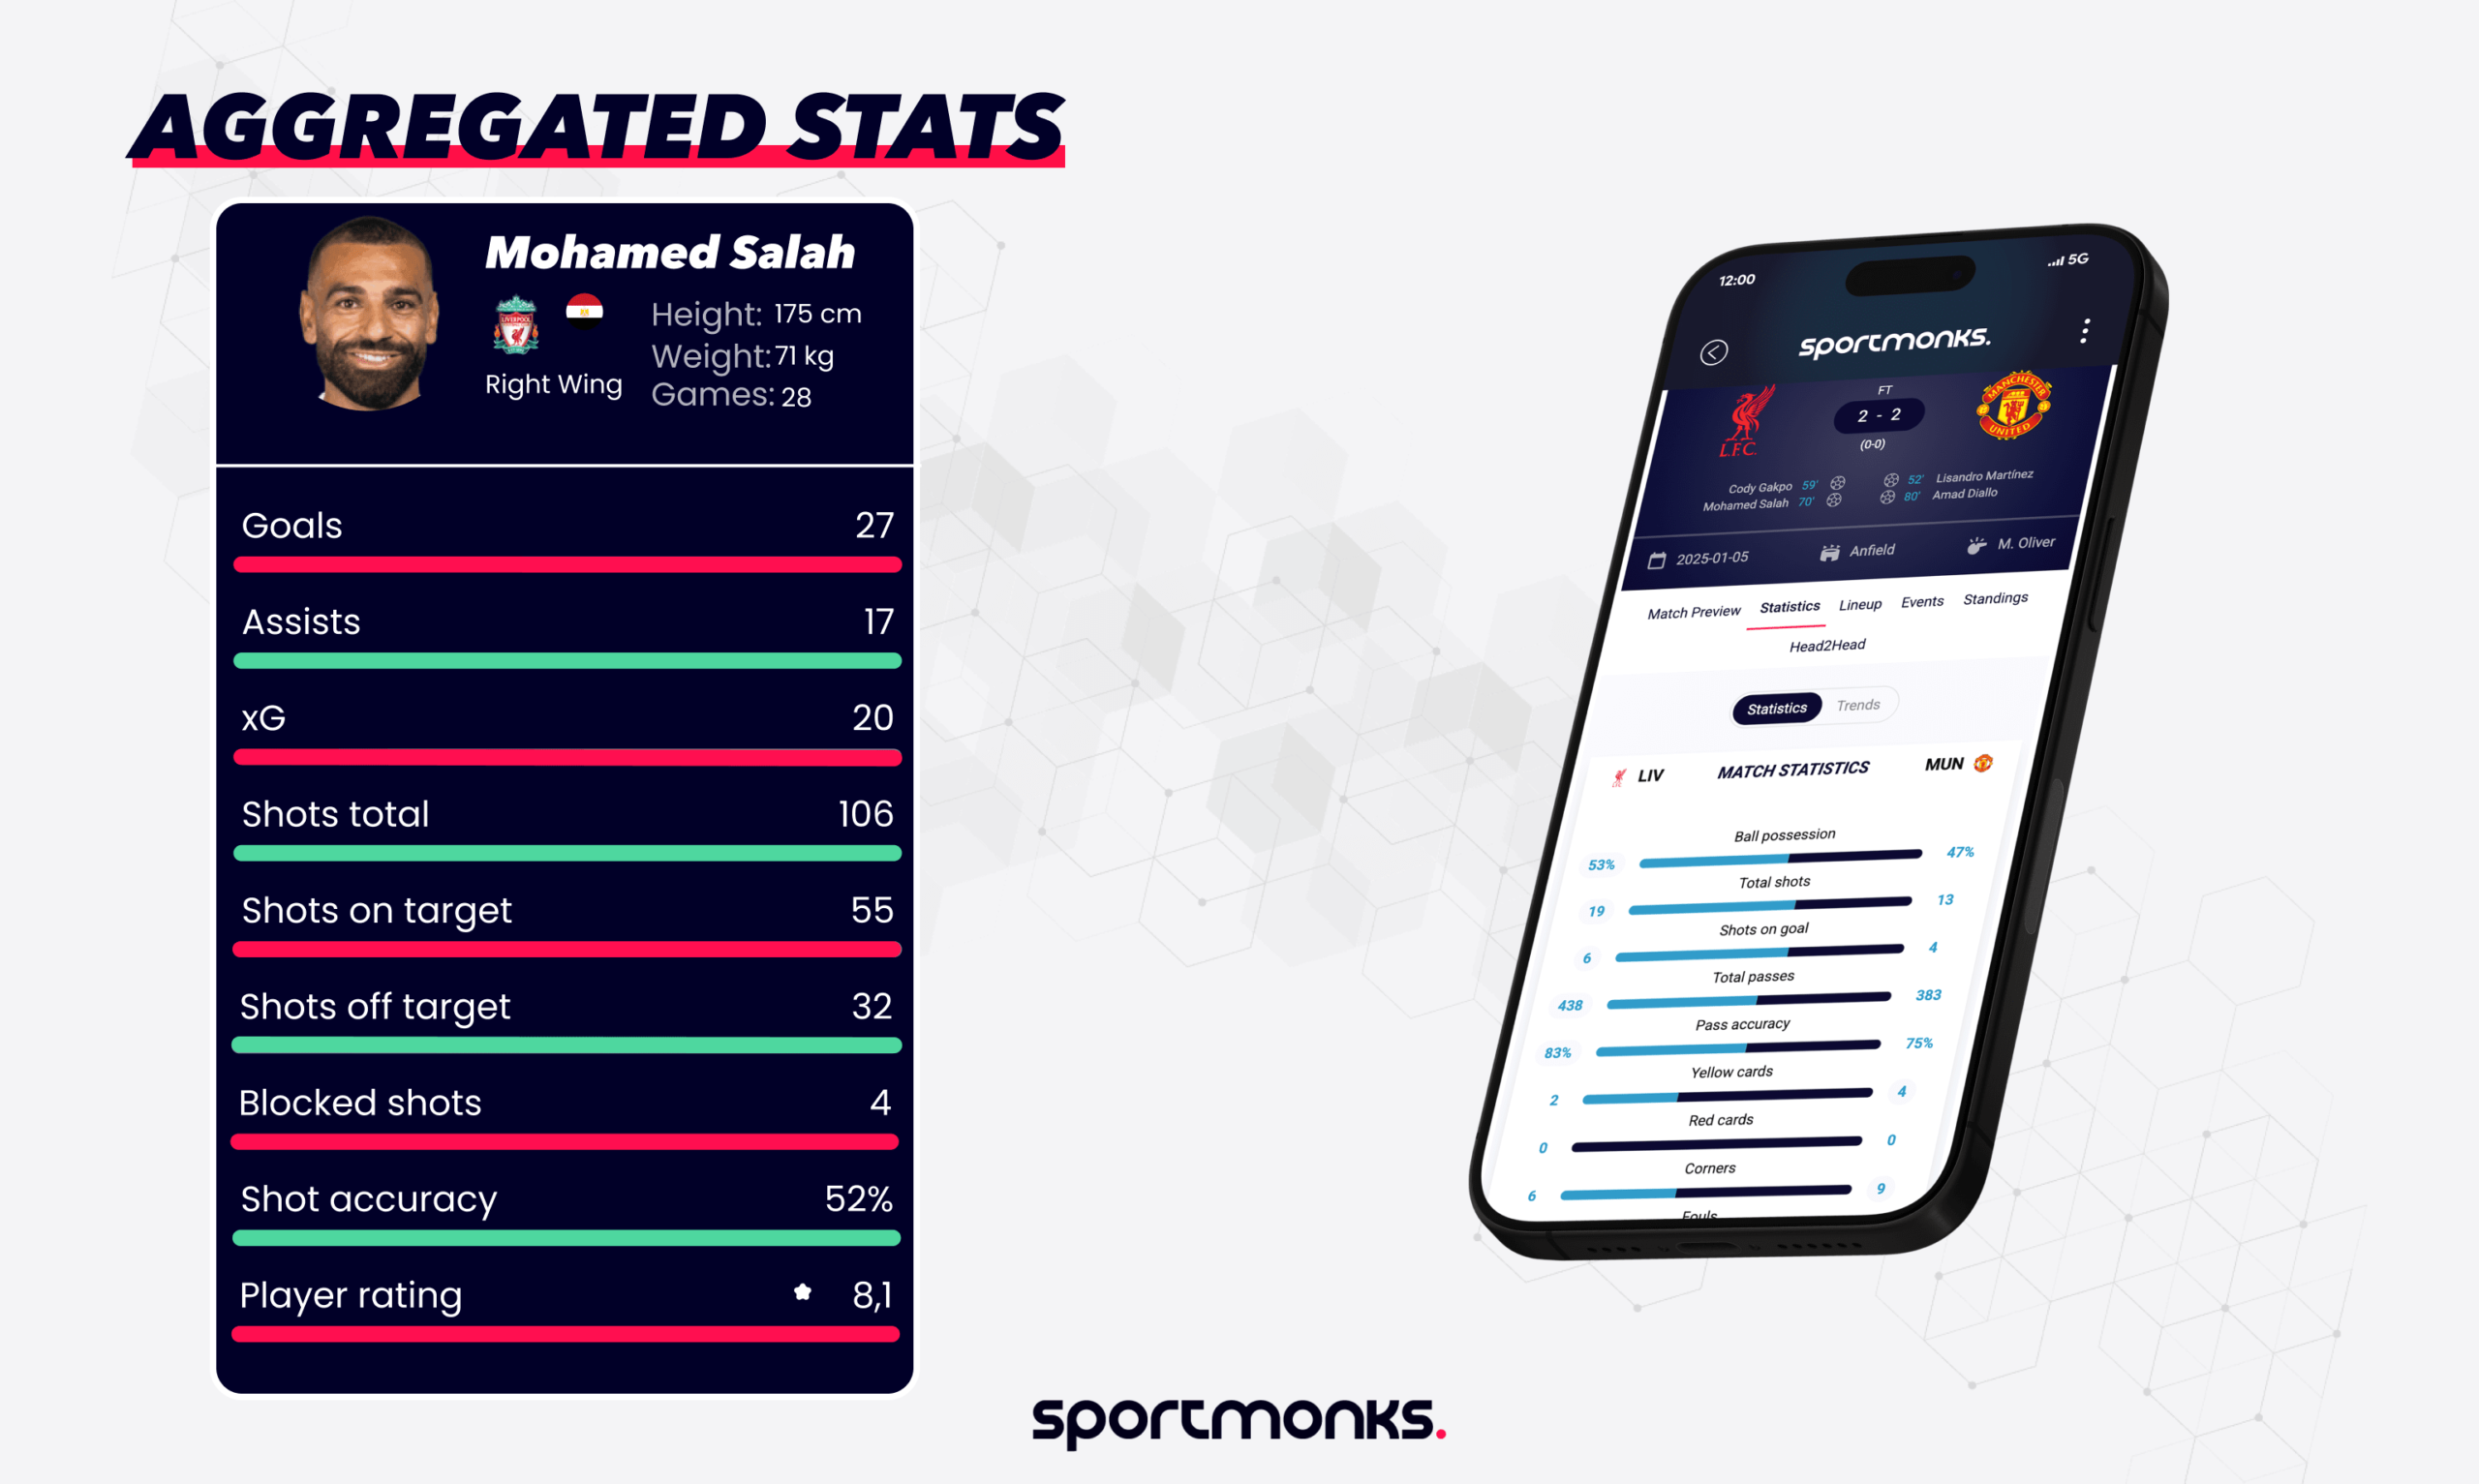
– Goals: Total goals scored by a player or team, e.g., season-long totals showing offensive output (Sportmonks API: “GOALS”, ID: 52).
– Assists: Total final passes leading to goals, reflecting playmaking ability (Sportmonks API: “ASSISTS”, ID: 79).
– Shots total: Sum of all shots attempted, including on target, off target, and blocked, indicating attacking intent (Sportmonks API: “SHOTS_TOTAL”).
– Shots on target: Total shots requiring a goalkeeper save or resulting in a goal, measuring shot accuracy (Sportmonks API: “SHOTS_ON_GOAL”).
– Dangerous attacks: Count of threatening attacking plays, like penalty area entries, showing offensive pressure (Sportmonks API: “DANGEROUS_ATTACKS”, ID: 44).
– Crosses: Total crosses attempted, often aggregated for wing play analysis (Sportmonks API: “TOTAL_CROSSES”, ID: 98).
– Expected goals (xG): Sum of xG values for shots, estimating expected goals based on shot quality, a key metric for performance evaluation (Sportmonks API: available in advanced plans).
Defensive statistics
– Tackles: Total successful tackles, showing ability to dispossess opponents (Sportmonks API: “TACKLES”, ID: 78).
– Interceptions: Count of intercepted opponent passes, reflecting defensive anticipation (Sportmonks API: “SUCCESSFUL_INTERCEPTIONS”: ID: 66).
– Clearances: Total balls cleared from dangerous areas, indicating defensive resilience (Sportmonks API: “CLEARANCES”: ID: 101).
– Saves: Total goalkeeper saves, measuring shot-stopping ability (Sportmonks API: “SAVES”: ID: 57).
– Blocked shots: Total shots blocked showing defensive commitment (Sportmonks API: “BLOCKED_SHOTS”: ID: 97).
Possession statistics
– Ball possession: Average percentage of match time controlling the ball, indicating control (Sportmonks API: “BALL_POSSESSION”: ID: 45).
– Passes: Total passes attempted, reflecting involvement in play (Sportmonks API: “PASSES” ID: 80).
– Pass accuracy: Percentage of successful passes, measuring passing reliability (Sportmonks API: “SUCCESSFUL_PASSES_PERCENTAGE” ID: 82).
– Key passes: Total passes leading to shots, showing creative impact (Sportmonks API: “KEY_PASSES”: ID 117).
Disciplinary statistics
– Yellow cards: Total cautions received, indicating disciplinary tendencies (Sportmonks API: “YELLOWCARDS”, ID: 84).
– Red cards: Total ejections, reflecting severe infractions (Sportmonks API: “REDCARDS” ID: 83).
– Fouls: Total rule violations, showing physicality or lack of discipline (Sportmonks API: “FOULS” ID: 56).
– Fouls drawn: Total fouls won, indicating ability to draw infractions (Sportmonks API: “PLAYER_FOULS_DRAWN”: ID: 96).
Other statistics
– Offsides: Total offside calls, reflecting attacking timing (Sportmonks API: “OFFSIDES”, ID: 51).
– Corners: Total corner kicks awarded, indicating attacking pressure (Sportmonks API: “CORNERS”, ID: 34).
– Substitutions: Total player substitutions, showing tactical flexibility (Sportmonks API: “SUBSTITUTIONS”, ID: 59).
– Goal kicks: Total goal kicks taken, often tied to defensive play (Sportmonks API: “GOAL_KICKS” ID: 53).
– Throw-ins: Total throw-ins awarded, reflecting ball retention or loss (Sportmonks API: “THROWINS” ID: 60).
– Duels won: Total ground or aerial duels won, indicating physical competitiveness (Sportmonks API: “DUELS_WON” ID: 106).
– Dribbles successful: Total completed dribbles, showing ball-carrying skill (Sportmonks API: “SUCCESSFUL_DRIBBLES” ID: 109).
– Minutes played: Total time on the pitch, useful for per-90-minute calculations (Sportmonks API: “MINUTES_PLAYED” ID: 119).
– Injuries: Count of reported injuries, aiding squad management (Sportmonks API: available for select leagues Sportmonks API: “INJURIES” ID: 87).
– Penalties scored: Total penalties attempted and converted, showing clutch performance (Sportmonks API: “PENALTIES_SCORED” ID: 111).
Explore Sportmonks’ football stats today
Unlock the power of football analytics with the Sportmonks football API. Dive into a wealth of aggregated statistics, from goals and assists to xG and pass accuracy, covering over 2,500 leagues worldwide. Whether you’re a coach analysing team performance, a developer building a stats-driven app, or a fan exploring player trends, our API delivers the data you need to make informed decisions. Sign up for a free trial at MySportmonks.com and start discovering our extensive stats library today.